
REPORTS & DASHBOARDS
Turn analysis into decisions your team can share.
Build focused reports and dashboards for underwriting, renewal, and executive review.
Request a demo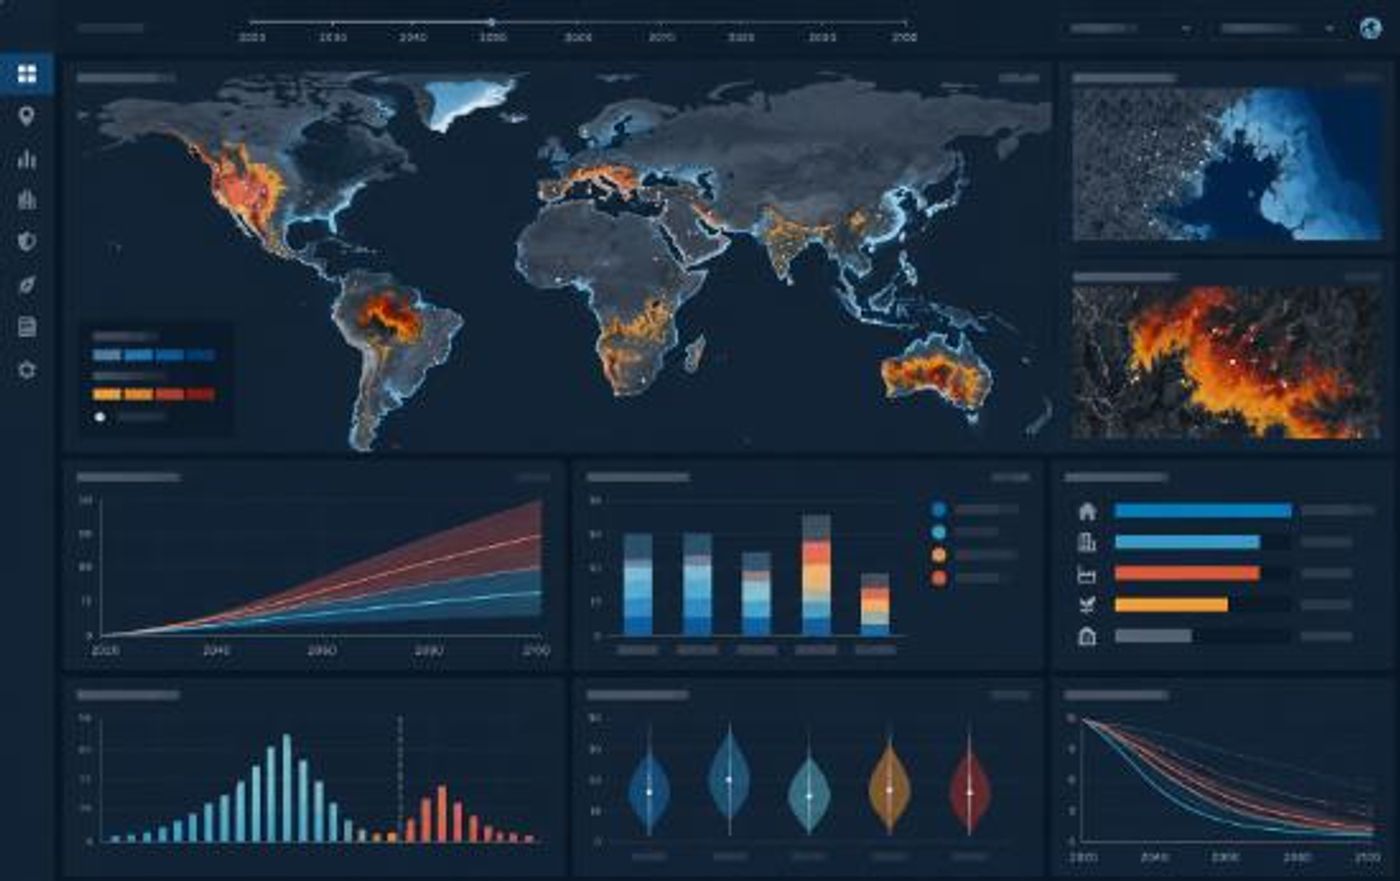
Transform portfolio analysis into clear, repeatable outputs for decision-makers. MAPTYCS® Reports & Dashboards brings maps, metrics and supporting detail together in views designed for underwriting, renewal, risk and executive review.
Make complex exposure easier to communicate
Build focused views around the questions your teams need to answer. Present portfolio composition, hazard exposure, concentrations and scenario results with consistent definitions so stakeholders can review the same evidence.
What you can do
- Create dashboards tailored to portfolios, perils and business workflows.
- Combine maps, charts and key exposure measures in one view.
- Produce consistent outputs for renewal and management review.
- Share analysis with internal stakeholders and external partners.