
RISK ANALYTICS & MAPPING
Map your entire portfolio against CAT zones in seconds.
Analyze accumulations, peril exposure, and property-level vulnerabilities on one precise geospatial canvas.
Request a demo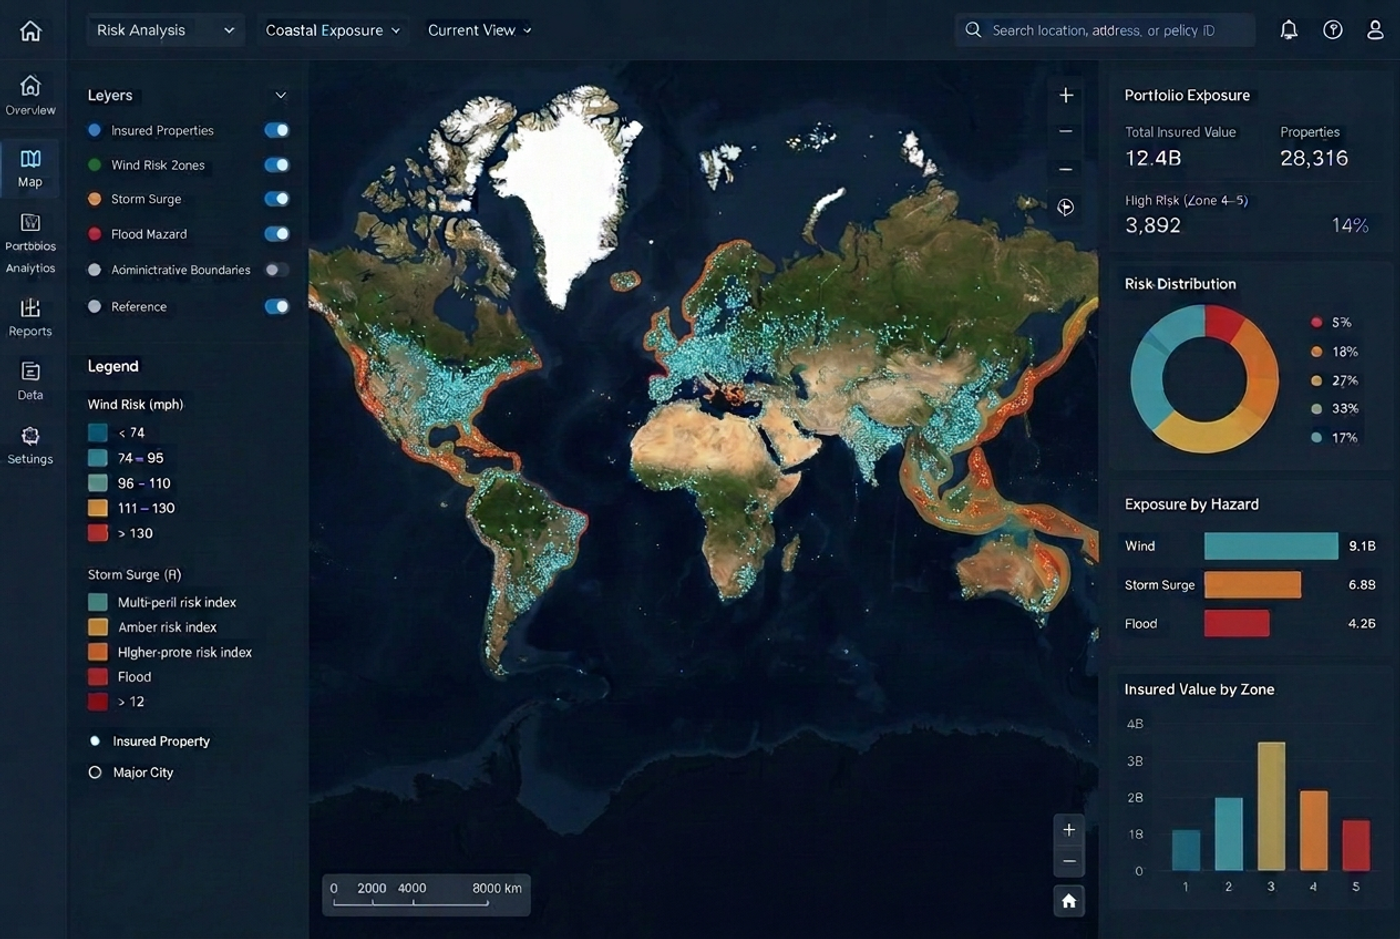
Bring every insured location, hazard layer and accumulation measure into one geospatial view. MAPTYCS® helps underwriting and risk teams move from fragmented property data to a clear portfolio-wide picture of exposure.
See concentration before it becomes a surprise
Explore exposure from global portfolio level down to individual properties. Compare locations with catastrophe and environmental risk zones, identify clusters of insured value and focus attention where limits and hazards overlap.
What you can do
- Map portfolios across countries, regions, perils and lines of business.
- Overlay trusted hazard zones and inspect exposure at property level.
- Analyze sums insured, concentrations and risk distribution in a consistent view.
- Give underwriting, portfolio and catastrophe teams a shared basis for decisions.