We recognize that data is only as useful as the insights you draw from it
MAPTYCS® is a geospatial risk assessment solution for property risk exposure management, climate risk analysis and real-time weather events monitoring. Users can visualize properties on a map and combine multiple datasets to gain a granular understanding of their risk exposure for one location or across their property portfolios.
MAPTYCS® Climate Change Module is a powerful engine that incorporates all IPCC CMIP6 geospatial data between now and 2100, to offer the ability to assess vulnerabilities in the property portfolio, assist in the company ESG effort and advise on long-term investments. The module is conceived to build a custom climate change profile (Temperature Max, Mean, Min, Total precipitation, Wind, Snowfall, Population density, Sea level rise) for any location in the world.
We have also developed a dedicated yachts tracking platform integrating AIS data in real-time via API.
Business Intelligence and Data Visualisation Services
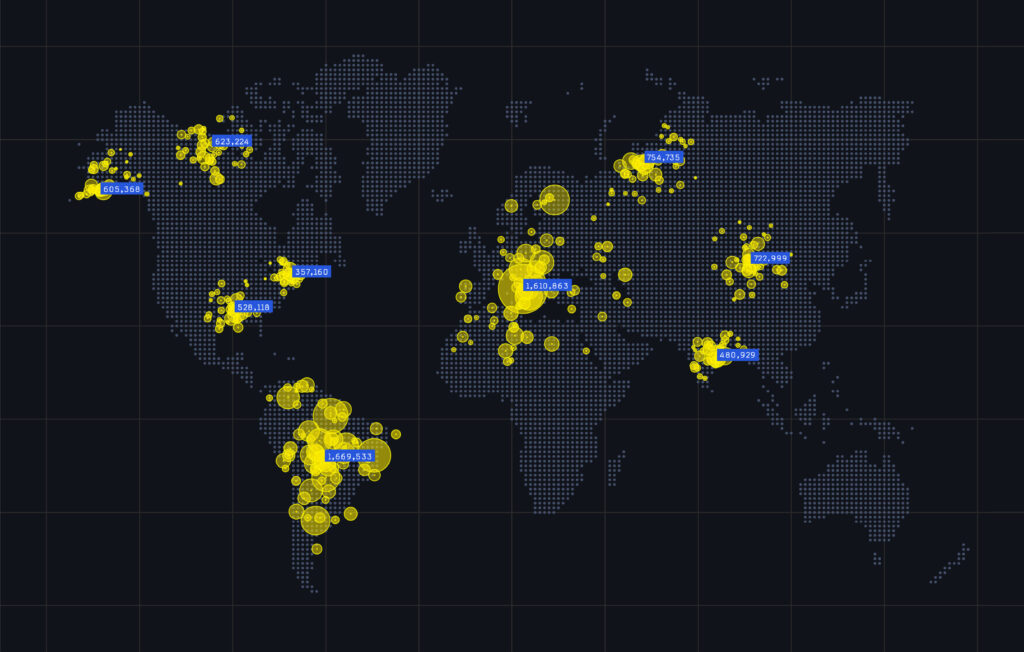
Quickly upload and visualize large datasets from proprietary, public, and third-party sources for faster and more accurate analysis.
This includes your property portfolios exposure data, natural catastrophes maps, historical events, information from government agencies & emergency response organizations.
We are building partnerships with the best data providers & CAT modeling companies in the industry.
Advanced Risk Analytics
Quickly assess property risk exposures and vulnerabilities
Visualize property assets on a geospatial map to get a quick view on the spread of values of your portfolio.
Map portfolio data against CAT zones.
Calculate and visualize accumulations of values on selected radius or geographic area.
Draw shapes on the map to create custom “what if” scenarios and quickly analyze risk exposures in selected areas.
Real Time Threat Monitoring
Monitor real time events to manage crisis response.
Track weather events as they unfold to swiftly calculate projected losses and proactively manage loss mitigation, business continuity, and crisis response.
Manage claims management resources with efficiency.
Custom Reporting
Smarter decisions require smarter reports
Create custom, dynamic, and interactive reports quickly to identify actionable insights, download, and share your analyses with stakeholders.
Develop renewal submission reports and ESG reporting with our preset automated reports.