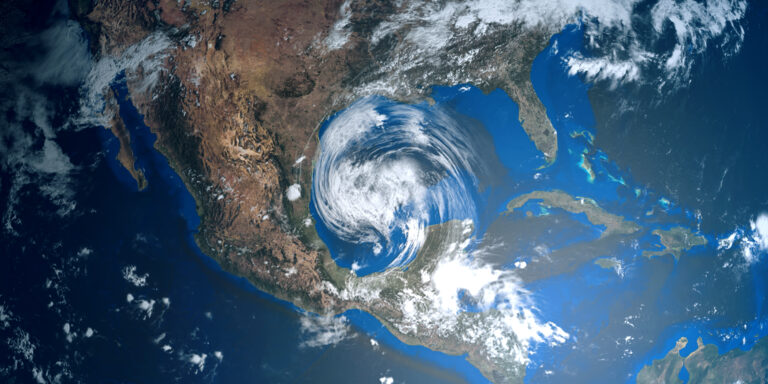
Big data only as useful as ability to visualize insights.

Geospatially visualizing risk exposure data is crucial for risk and insurance professionals as the quantity of data increases every year – “the data is either too large to grasp or it’s not clear how the data is being manipulated.”

Tapping into the actionable insights hidden in your risk exposure data is possible on the Maptycs platform, where users bring together data across multiple formats and sources with real-time weather events to bolster and adjust their risk strategies. Connect with our team to see Maptycs in action.

#risktech #insurtech #riskmanagement #geospatialdata

Related Posts

Maptycs will be at RIMS Risk World 2024 in San Diego this May. We would love

MAPTYCS is an extraordinary product for the increasingly complex world of risk management, bringing clarity, precision,

According to the SwissRe Institute, global insured losses from natural catastrophes exceeded $100 billion for the

MAPTYCS is excited to announce our new strategic partnership with Tensor Flight. Having best in class

Meteorologists are predicting a challenging hurricane season ahead. The current El Niño pattern has brought unseasonably

Integrating new data into underwriting and risk management is critical. With advancements in sensors, aerial imagery,

According to this recent article in Insurance Journal, companies are trying to figure out how to

Cyclone Gabrielle brought heavy winds and rain to New Zealand in February of 2023. According to

AMRAE 2024 has been a productive and enjoyable conference for MAPTYCS®. We have been catching up

While property rate increases may be slowing, CAT exposed property continues to drive premiums higher for

With an escalation in natural disaster events, property insurance costs have been increasing. As a result,

We are happy to announce that Noah Barrengos has joined our MAPTYCS® team as a Client